![]()
Website: https://www.wireshark.org/
¶ Contents
¶ Things To Note
¶ Using Wireshark in Linux
The wireshark-cli install script sets packet capturing capabilities on the /usr/bin/dumpcap executable
/usr/bin/dumpcap can only be executed by root and members of the wireshark group, so to use Wireshark as a normal user, you have to add your user to the wireshark user group. To do this, run sudo usermode -aG wireshark $USER.
¶ Interface
The main section shows the "Packet List" - these are usually automatically colourised depending on their category. These colours are default ones set up by the Wireshark devs, however, if you wish, you can change them.
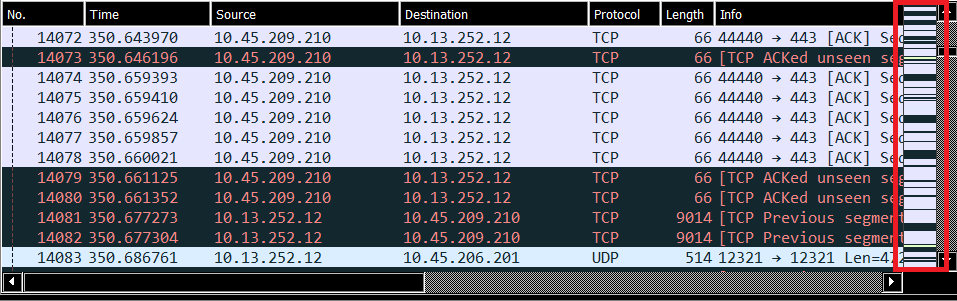
On the far right of the Packet List, we can see the Intelligent Scrollbar. The colours here are based on the same colours seen in the main summary section. This allows you to quickly scroll through the capture to try to identify areas of interest (typically these will be in black or red, however large areas of yellow can also be of interest).
The quickest way to analyse the packet capture is to use the "Expert Information" option found un the "Analyze" menu.
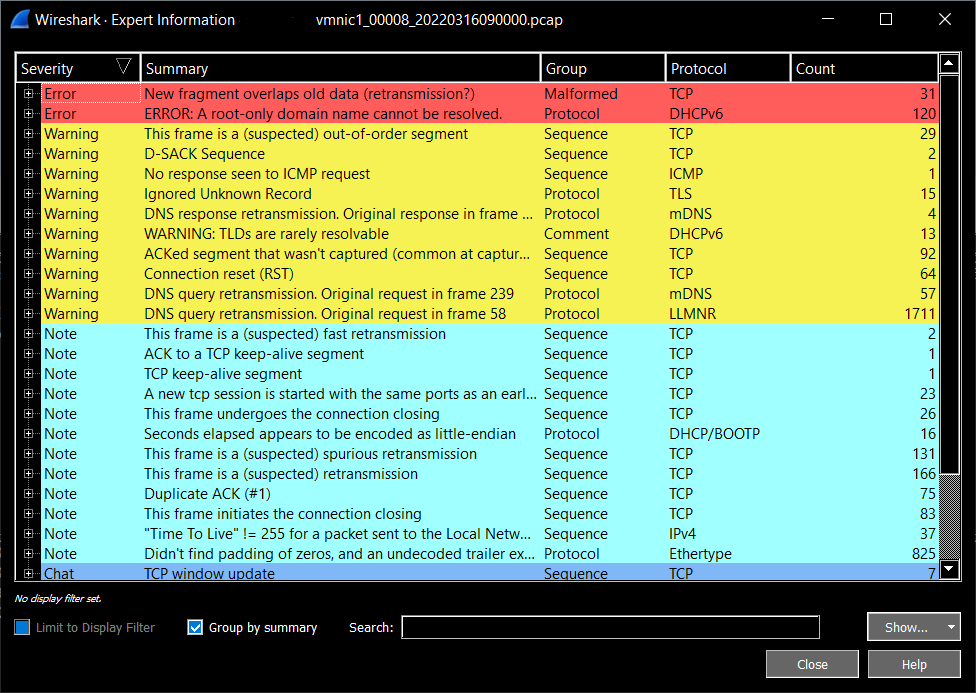
As you can see, this will count the number of packets per severity so you can quickly check if there are any errors (in red) or warnings (in yellow). If you wish to view the packets in those categories, you can
- Right click on the summary type you want to view
- Apply as filter
- Selected
| Packet field | Info |
|---|---|
[Stream index: 0] |
field inserted by Wireshark |
Sequence Number: 1 |
Relative sequence number to the stream - not the actual value |
Window size |
indicates the buffer size |
Differentiated Services Field |
priority (0=best effort) |
Header checksum: xxxxxx [validation disabled] |
this is disabled as this function is often offloaded so prevents false errors from being flagged (can be turned on if desired) |
¶ Darkmode
In Windows, you will need to run with the following command:
Wireshark.exe -platform windows:darkmode=2
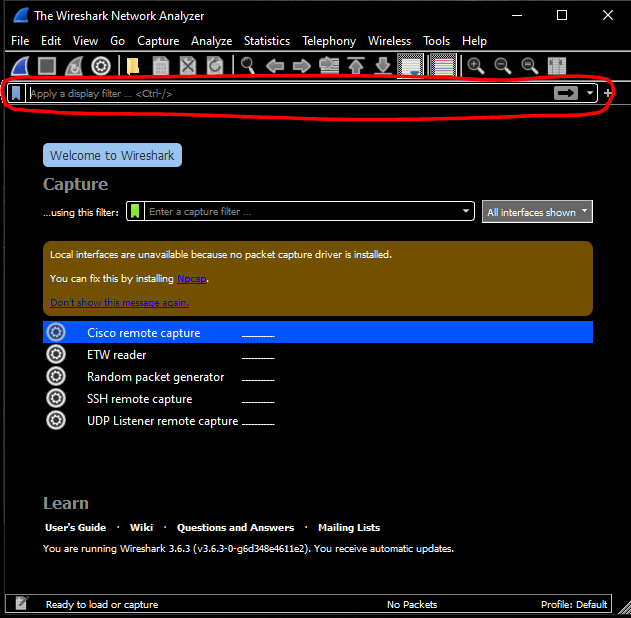
¶ Filters
¶ Capture Filters
Set before capturing packets. This will only capture the packets for which you filtered
| Filter | Action |
|---|---|
tcp port 21 |
Only captures packets on port 21 (FTP). |
¶ Display Filters
Set whilst viewing a capture (live or otherwise).
| Filter | Action |
|---|---|
_ws.expert.severity == error |
Filters for packets in 'error' state |
_ws.expert != OK |
Filters for packets that are not 'OK' |
_ws.malformed |
Shows packets marked as malformed |
eth.len.past_end |
Shows packets where "Length field values goes past the end of the payload" |
ip.addr == 255.255.255.255 |
Shows IP matching "255.255.255.255" |
ip.bogus_ip_length |
Shows packets where "IPv4 total length exceeds packet length (9000 bytes)" |
ip.src == 10.0.0.1 |
Show packets with source IP of 10.0.0.1 |
ip.addr =10.0.0.0/24 |
Show packets in the IP subnet /24 |
tcp.port == 80 |
Show packets using port 80 |
tcp.flags.syn == 1 |
Show TCP SYNs |
tcp.stream == 16 |
Show TCP stream 16 |
You can filter OUT items by enclosing the filters in !(). For example
!(ip.addr == 10.0.0.1)would remove all references to packets where source or destination is equal to 10.0.0.1
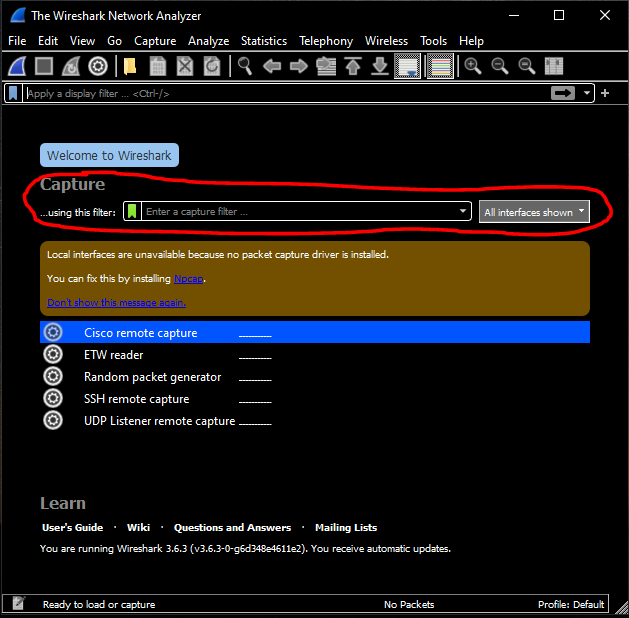
¶ Useful for setting up filters
You can also set up filters very quickly using the built-in analyzer. See under the Interface section for further information.
A quick way to add filters is to simply drag the 'cell' from the 'packet view' and drop it in to the filter bar at the top.
¶ Handling Large pcap files
Tools for hanlding large pcap files:
¶ tcpdump
Command tcpdump can be used to split pcap files. This can be installed on Linux and MacOS - un
tcpdump -r old_file -w new_files -C 10
This will take your old_file and output to newfile+n where 'n' is a number. The -C switch defines the number of million bytes to split the file in to.
In the example above, this would split "old_file" in to files of 10 million bytes called "newfile1", "newfile2" and so on.
¶ editcap
A utility which can be used is editcap which is distributed with Wireshark.